
Agentic Browsing Audit launch
A Chrome DevTools extension for finding agentic browsing issues in dialogs, menus, drawers, popovers, form errors, checkout steps, and other UI states.
Share
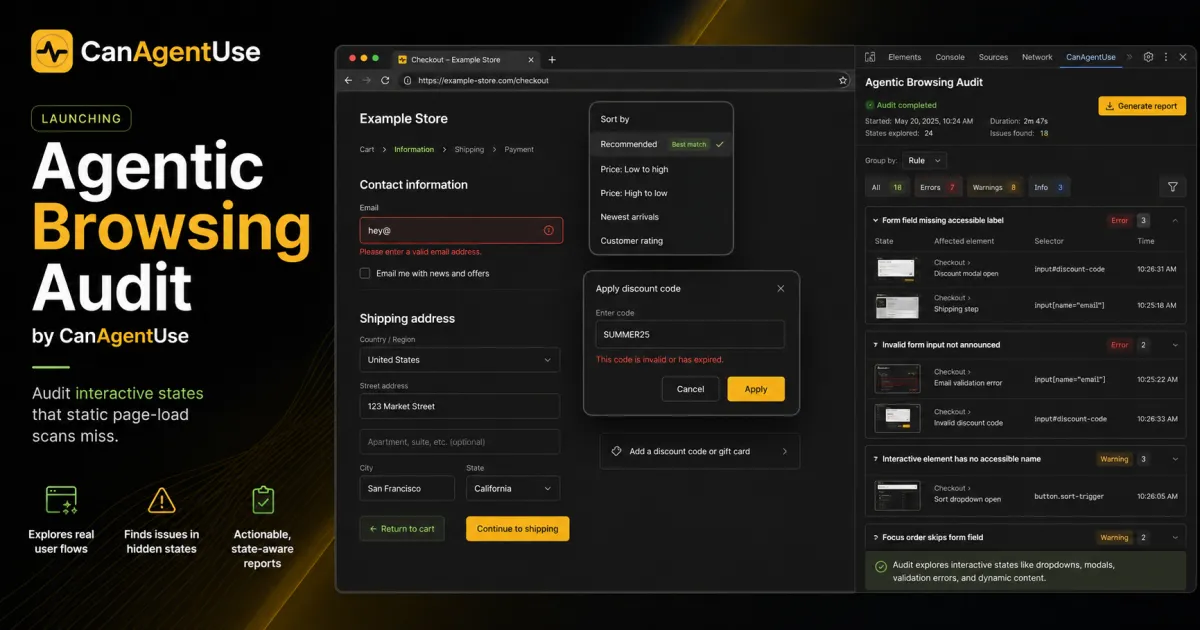
Dynamic UI is where browser-agent testing gets awkward.
A normal scanner can load a public URL and inspect the page it receives. That helps. But it may never open the account menu, trigger the checkout drawer, reveal the shipping dialog, hover the tooltip, expand the filter dropdown, or submit the form badly enough to show validation errors.
Those states matter because that is where people pay, sign up, recover from mistakes, change settings, or ask for help.
Today we are launching Agentic Browsing Audit, a Chrome DevTools extension for finding agentic browsing issues in dialogs, menus, drawers, popovers, form errors, checkout steps, and other UI states.
Install it from the Chrome Web Store:

TL;DR: Log in, create an audit session, open the UI state you want to test, then scan it manually or with conservative auto scan. The report groups agentic browsing issues and includes screenshots, selectors, URLs, timestamps, and fixes.
What launched
Agentic Browsing Audit adds a CanAgentUse panel inside Chrome DevTools. The toolbar popup explains the workflow when someone clicks the extension icon.
The workflow is intentionally tester-led:
- Log in with your CanAgentUse account.
- Create an audit session.
- Choose manual scan or turn on auto scan.
- Trigger an interactive state on the webpage.
- Run a scan, or let auto scan run after the page settles.
- Repeat for each state that matters.
- Click Generate Report.
The report groups agentic browsing findings by rule and category. Inside each group, you can move through the affected elements with the URL, timestamp, selector, screenshot, and fix guidance for each one. The extension does not try to guess every possible state on your site. It helps you test the states your team already knows people use.
The product page has the Chrome Web Store install link and the current workflow.
Why interactive states need a separate pass
Many agentic browsing failures do not appear on first load. They appear after a click, a hover, a failed submit, a filter change, or a modal transition.
The extension is meant for states like these:
| Interactive state | What can break |
|---|---|
| Dialogs | Missing dialog names, focus leaks, unlabeled close buttons, hidden headings |
| Dropdowns | Missing expanded state, ambiguous options, selected value not exposed |
| Drawers | Background still operable, checkout controls without clear labels |
| Menus | Clickable divs, missing menu item names, keyboard path gaps |
| Hover states | Tooltips and popovers that disappear before inspection |
| Form errors | Visual-only errors, unlinked messages, invalid state not exposed |
A page can look polished and still fail here. The failure is usually not visual. It is structural. The role is wrong. The name is missing. The selected state is only a color. The form error is nearby but not connected to the field. The success toast disappears before an agent can confirm the action.
This is the gap the extension fills. A first-load scan tells you what the page exposes by default. Agentic Browsing Audit lets you open the states that only appear after interaction and scan them directly.
How to use it on a real site
Start with a flow people actually use. Signup, checkout, account settings, search filters, onboarding, support forms, billing, and admin dashboards are good candidates.
Open DevTools on the page and select the Agentic Browsing Audit tab. Log in, create a session, then operate the site the way a user would. Use manual scan when you want deliberate coverage. Turn on auto scan when you want the extension to watch interactions and scan after the page settles.
For example:
- Open the checkout drawer and scan it.
- Open the shipping address dialog and scan it.
- Submit the form with a missing required field and scan the validation state.
- Open the payment method dropdown and scan it.
- Open the account menu and scan it.
- Generate the report.
Each scan belongs to the same session, but the final report starts with the agentic browsing issue groups. A developer can open a group, then cycle through affected elements with the time, URL, selector, screenshot, and scan where the issue appeared.
What the report includes
The report is more than a score.
For each agentic browsing issue group and affected element, the report can include:
- The absolute page URL.
- The scan timestamp.
- Affected selectors and elements.
- Element and state screenshots.
- The scan trigger when available.
- Fix guidance tied to the finding.
That matters because dynamic bugs are easy to lose. Someone says, "the dropdown is broken," but the dropdown only appears after a specific filter path. Someone else says, "the agent cannot use checkout," but the actual issue is the payment drawer's unlabeled submit button.
That detail helps because dynamic bugs are easy to lose in translation. Product, design, QA, accessibility, and engineering teams can look at the same report instead of trading screenshots in chat.
Get the extension
Install Agentic Browsing Audit from the Chrome Web Store and start with one flow people rely on.
Pick a page, trigger the states users actually hit, run scans manually or with auto scan, and generate the report when the session is complete.
That is the simplest way to find the issues hiding behind the first page load.
Share