Agent Website Viewer launch: see your page the way AI agents see it
CanAgentUse Agent Website Viewer turns a public web page into an agent-readable map of structure, controls, names, states, warnings, and interaction signals.
Share
Your website has two versions. One is the page people see: layout, color, spacing, animation, visual hierarchy. The other is the page an AI agent has to operate: headings, controls, names, roles, links, forms, dialogs, menus, focus states, and messages that explain what just happened.
Those two versions can disagree. A button can look obvious and still have no useful name. A checkout step can feel clear to a person and still leave an agent unsure whether it succeeded. A form can be beautiful, then fail because the fields and errors are hard to read as machine-usable structure.
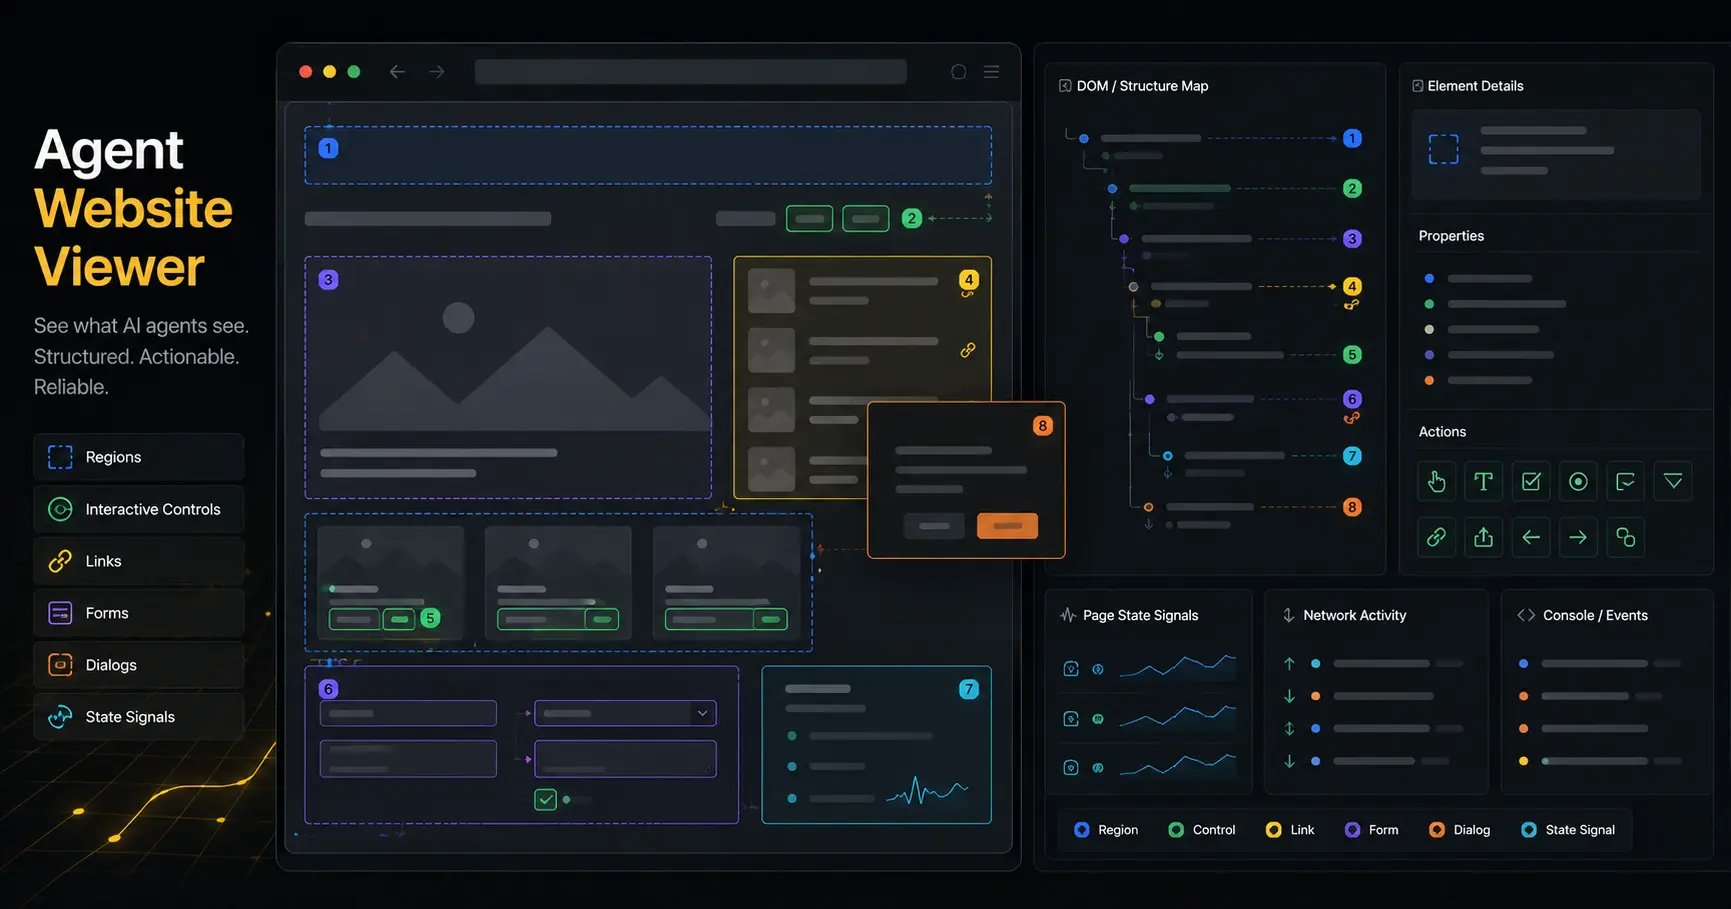
CanAgentUse now has an Agent Website Viewer for that second version. Enter a public URL and the tool builds an agent-facing map of the page. It shows what a browser-exposed agent can read, which controls it may be able to operate, which states appear after interaction, and which parts of the page are likely to confuse automation.
Agent Website Viewer is a free CanAgentUse tool that turns a public page into an agent-readable map of structure, controls, names, states, warnings, and interaction signals.
Why we built it
Most web agents do not start with your design file. Many inspect the browser's exposed page structure, the same underlying layer used by assistive technology and automation tools. That layer is where button names, input labels, page regions, menu states, dialog states, and form errors become visible to software.
That means a page can look complete while the agent's view is thin. The agent may see five unnamed buttons, a form field without a label, a custom dropdown with no current state, or a success message that appears visually but not in the page structure it can inspect.
Agent Website Viewer makes that hidden version visible. Instead of asking a developer to jump between browser devtools, audit output, snapshots, and manual checks, it puts the agent map in one report.
| What the agent needs | What can go wrong |
|---|---|
| A named action | Buttons appear as "button" with no purpose |
| A readable form | Inputs do not expose labels or current values |
| A stable page outline | Important areas are hidden inside generic containers |
| A clear state change | Menus, dialogs, and validation states are hard to detect |
| A completion signal | The page does not clearly say whether the task worked |
What the viewer shows
Run a URL and the viewer builds a report around the agent's working view of the page. The main view is an agent map: page regions, headings, links, buttons, inputs, lists, dialogs, menus, and exposed states in a plain readable outline.
The raw tree is there when you need the exact structure. It is useful for developers debugging why a control has the wrong name, why a dialog is not visible in the agent map, or why a custom component behaves like a generic block.
The report also checks interaction states where it can. Focus, hover, menu, dialog, and control changes often decide whether an agent can complete a task. If a dropdown opens but the selected option is not exposed clearly, the agent may still be guessing.
| Viewer area | What it helps inspect |
|---|---|
| Agent map | The readable structure agents can use |
| Raw tree | The underlying browser-exposed page snapshot |
| Issue list | Controls, labels, structure, and states that may block agents |
| Interaction states | Focus, hover, menus, dialogs, and control changes |
| Element details | Selectors, impact, affected nodes, and fix guidance |
| Warnings | Capture limits, skipped checks, and page loading problems |
The useful question is simple: if the visual design disappeared, would the page still explain itself well enough for an agent to act?
Use cases
Use it before asking agents to complete a workflow. Run the page where the task starts, not only the homepage. Pricing pages, sign-up flows, checkout steps, support forms, dashboards, and account settings are all good candidates.
Use it after an agent gets stuck. If the agent clicks the wrong control, loops after submission, misses an error, or cannot tell whether a task finished, the viewer can show whether the needed signal exists in the agent-readable page.
Use it during product QA. When a team ships a new component, modal, selector, or form, the viewer shows whether the component exposes enough structure for agents and automation tools to understand it.
Use it before investing in protocols. llms.txt, OpenAPI, MCP, and Agent Cards can all help, but many tasks still start in the browser. If the browser view is hard for agents to read, a protocol file will not save a broken button.
Limits and safety boundaries
Agent Website Viewer works on public URLs. It blocks private and internal network targets. It does not use your browser cookies, account session, or private dashboard access.
The viewer is a snapshot, not a full autonomous agent run. It can show the page structure and some interaction states, but it does not complete long workflows, solve captchas, log into accounts, or prove that every agent will behave the same way.
It also cannot fix the page for you. It gives selectors, affected elements, warnings, and guidance so the team can update names, controls, states, messages, and structure in product code.
Some interfaces are hard to inspect completely. Canvas-heavy apps, closed shadow DOM, aggressive bot defenses, delayed hydration, geofenced content, and login-only pages may return partial evidence. When that happens, the warnings panel is part of the report, not an afterthought.
Cost
Agent Website Viewer is free to use on CanAgentUse. There is no CanAgentUse charge for running a public URL through the viewer.
The target site may still see normal page traffic from the scan. If a page has analytics, bot filtering, rate limits, or metered rendering infrastructure, those systems may record the request. The viewer does not submit forms or intentionally perform write actions, but page loads can still trigger ordinary site-side logging.
The main cost is the work after the report: naming controls, clarifying page structure, replacing brittle components, exposing errors clearly, and making success states obvious in text and page state.
How it fits with CanAgentUse
Agent Website Viewer is the product you open when a readiness score is too abstract. The scanner can say that a page has structural problems. The viewer shows the page as an agent-readable map so a developer can see the problem in context.
That is especially useful because many agent failures are not protocol failures. A site can publish llms.txt, OpenAPI, MCP metadata, and Agent Cards, then still fail a basic browser task because the agent cannot tell which control to press or whether the submit action worked.
The practical order is still the same: make the page understandable, make actions reliable, then publish machine-readable protocols. The viewer helps with the first two.
FAQ
What is Agent Website Viewer?
Agent Website Viewer is a CanAgentUse tool that shows the page structure and interaction signals an AI agent can read from a public web page.
Does Agent Website Viewer show exactly what every agent sees?
No. Agents use different browser stacks and models. The viewer shows a practical browser-exposed view that many agents and automation systems rely on.
Can it scan private dashboards?
No. It is designed for public URLs and blocks private or internal network targets. It does not use your browser cookies or logged-in session.
Is Agent Website Viewer free?
Yes. CanAgentUse does not charge for using the viewer. The target site may still log the page request like ordinary traffic.
Share